Learning Zone
Good driver vs bad driver behaviour infographic
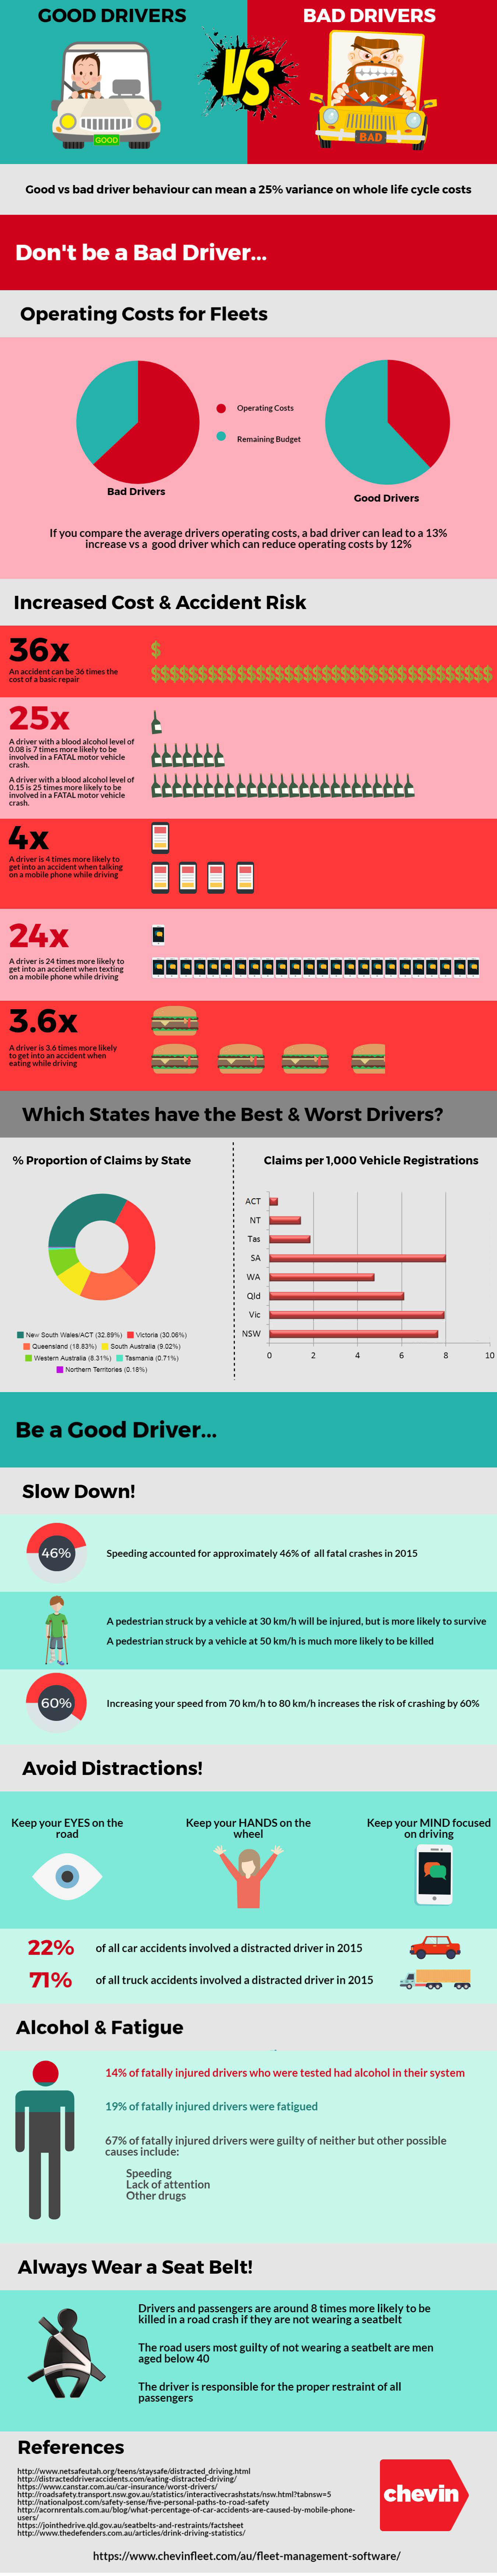
Good vs bad driver behavior can mean a 25% variance on whole life cycle costs
Influencing a culture of good driver behaviour is essential for all fleet managers – the difference in whole life cycle costs between a fleet of good drivers compared to a fleet of bad drivers can be 25%. Data collected from Chevin’s customer base shows that the best drivers can reduce costs by more than 12%, but the worst drivers can increase costs by more than 13%.
An accident can be 36 times the cost of a basic repair, so ensuring you have a strategy to reduce the risk of accidents within your fleet must be a priority for all fleet managers.
Increased Cost & Accident Risk
Good drivers not only save money, they are also a lot safer behind the wheel. According to NetSafeUtah.org and VeryWell.com:
- A driver with a blood alcohol level of 0.08% is 7 times more likely to be involved in a fatal motor vehicle crash
- A driver with a blood alcohol level of 0.15% is 25 times more likely to be involved in a fatal motor vehicle crash
- A driver is 6 times more likely to get into an accident when eating while driving
- A driver is 4 times more likely to get into an accident when talking on a cell phone while driving
- A driver is 24 times more likely to get into an accident when texting on a cell phone while driving
Tips to becoming a good driver
Slow Down:
- Speeding accounted for approximately 46% of all fatal crashes on the road in Australia in 2015
- Reducing your speed can be the difference between life and death: a person struck by a vehicle at 30 km/h will be injured, but is likely to survive, however a person who is struck by a vehicle travelling at 50 km/h is much more likely to be killed
- Increasing your speed from 70 km/h to 80 km/h increases the risk of crashing by 60%
Avoid Distractions:
- Keep your eyes on the road, hands on the wheel and mind focused on driving
- 22% of all car accidents involved a distracted driver in 2015
- 71% of all truck accidents involved a distracted driver in 2015
Don’t drink & drive, and get plenty of rest:
Of all fatally injured drivers who were tested in 2015:
- 14% were alcohol-related
- 19% were fatigued
Always wear a seat belt:
- Drivers and passengers are around 8 times more likely to be killed in a road crash if they are not wearing a seatbelt
- Road users most guilty of not wearing a seatbelt are men aged below 40
- Remember, the driver is responsible for the proper restraint of all passengers
How Fleet Managers can improve their drivers’ performance
By storing all your driver information in one central location such as fleet driver management software, telematics or both integrated together, you can combine details such as accident rates, age, driver licence, sex, location, mileage, fuel economy and driver behaviour to help identify risk and send alerts to drivers on their own performance,
Fuel can account for around 30% of a fleet’s running costs, so there are clear benefits to educate your employees to drive more economically.
Better informed, more confident drivers also help to reduce accidents, insurance and maintenance expenses; this can also enhance and promote your organisation’s reputation and image.
The key to improving performance is measuring it – if you have a system in place that allows you to report on information, it can help you understand the causes and possible solutions.